
Утречко! (какое, нафиг, утречко — час дня)
Что-то у меня сегодня совсем не задалось настроение. Виной тому то ли погода, то ли моя рассеяность, то ли электро-индастриал в колонках. Поэтому мне очень лень что-то сегодня искать. Извините 😞
Но вот есть статья из загашника со сравнением Prometheus, Sensu и TICK Stack
Она старая, но, может, кому будет интересно
#monitoring #prometheus #sensu
Medium
The docker age: Monitoring showdown Prom vs. TICK vs. Sensu
After gathering information about the most popular products in the market, I wanted to get a feel of my 3 finalists: Prometheus, Sensu …
Ну суть, я думаю, вы уловили: вышел Prometheus 2.0
Из нового:
- переделали сторейдж. Обещают прирост производительности аж:
= CPU на 20%-40% меньше, чем в версии 1.8
= Место на диске: меньше на 33%-50% в сравнении с 1.8
= I/O и так, говорят, низкое былоек
- Staleness handling (видео презентации с PromCon 2017)
- Можно делать снэпшоты вот прямо всего хранилища
Changelog
Upgrade guide
Ну и, конечно же, бонус! Видосы c PromCon 2017
#monitoring #prometheus
prometheus.io
Announcing Prometheus 2.0 | Prometheus
An open-source monitoring system with a dimensional data model, flexible query language, efficient time series database and modern alerting approach.
A Deep Dive into Kubernetes Metrics - easy readable article series about monitoring nodes using Kubernetes and Prometheus.
- Intro
- Part 1
- Part 2
#monitoring #kubernetes #prometheus
- Intro
- Part 1
- Part 2
#monitoring #kubernetes #prometheus
Medium
A Deep Dive into Kubernetes Metrics
Part Zero: Introduction
While I was on vacantion Cloud Native Computing Foundation (CNCF) announced open source monitoring toolkit, Prometheus, has graduated from its incubation status.
To graduate from an incubating status to a graduated status, the project had to adopt the CNCF code of conduct, under-go an independent security audit and disclose its governance structure which outlines how they plan to grow their community.
#prometheus #monitoring #CNCF
To graduate from an incubating status to a graduated status, the project had to adopt the CNCF code of conduct, under-go an independent security audit and disclose its governance structure which outlines how they plan to grow their community.
#prometheus #monitoring #CNCF
So cool monitoring solution in Grafana for Prom users, but we still using Zabbix ¯\_(ツ)_/¯
https://grafana.com/blog/2018/09/21/grafanas-explore-ui-taking-a-deeper-dive-into-data-with-prometheus-queries/
#monitoring #grafana #prometheus
https://grafana.com/blog/2018/09/21/grafanas-explore-ui-taking-a-deeper-dive-into-data-with-prometheus-queries/
#monitoring #grafana #prometheus
Grafana Labs
Grafana’s Explore UI: Taking a Deeper Dive into Data with Prometheus Queries | Grafana Labs
Grafana Labs has created the Explore UI, which allows you to iterate quickly through Prometheus queries, while leaving your dashboards intact. This post will walk you through a demo and show you how to try it out yourself.
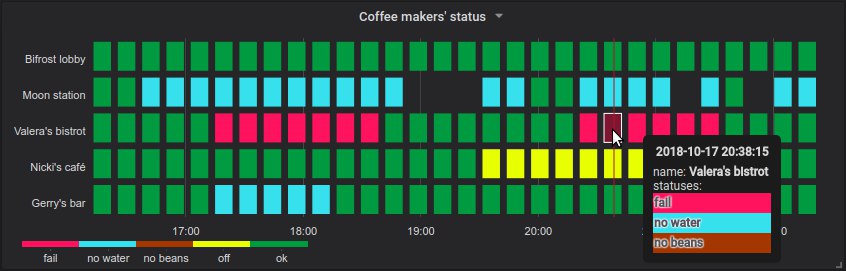
Cool grafana panel plugin to visualize status of multiple objects over time
https://github.com/flant/grafana-statusmap
Can be used as Status page or for investigation problems and their root case etc. Works with Prometheus and Grafana 5.
#monitoring #grafana #prometheus
https://github.com/flant/grafana-statusmap
Can be used as Status page or for investigation problems and their root case etc. Works with Prometheus and Grafana 5.
#monitoring #grafana #prometheus
Примеры использования PromQL от Aliaksandr Valialkin
+ вдогонку примеры, по которым я сам начинал с PromQL знакомиться
#monitoring #prometheus
+ вдогонку примеры, по которым я сам начинал с PromQL знакомиться
#monitoring #prometheus
Medium
PromQL tutorial for beginners
PromQL is a query language for Prometheus monitoring system. It is designed for building powerful yet simple queries…
Trickster - Open Source Dashboard Accelerator for Time Series Databases
Trickster was developed internally in Comcast, and half-year ago made available open source. Written in Go, Trickster is a reverse proxy cache for the Prometheus HTTP APIv1 that considerably accelerates dashboard rendering times for any series queried from Prometheus. This is possible because of the delta proxy, step boundary normalization, and fast forward features.
More info can be found at github and this youtube intro
#monitoring #prometheus
Forwarded from DevOps Deflope News
Сегодня и завтра проходит PromCon EU 2019 🔥
Расписание http://amp.gs/qMMA
И доступна онлайн трансляция http://amp.gs/qMMs
#promcon #prometheus #live
Расписание http://amp.gs/qMMA
И доступна онлайн трансляция http://amp.gs/qMMs
#promcon #prometheus #live
promcon.io
Schedule | PromCon EU 2019
PromCon, the conference about the Prometheus monitoring system and time series database
A list of awesome Prometheus alerts, divided by the nature. I.e. there are alerts for data bases, proxies and load balancers, storage, etc.
You can just copy-paste these into your monitoring code. Just keep in mind that the thresholds may be different for your particular case!
#observability #monitoring #prometheus
You can just copy-paste these into your monitoring code. Just keep in mind that the thresholds may be different for your particular case!
#observability #monitoring #prometheus
Forwarded from Sysadmin Tools 🇺🇦
Monitoring at scale with Victoria Metrics
https://tech.bedrockstreaming.com/2022/09/06/monitoring-at-scale-with-victoriametrics.html
#monitoring #victoriametrics #prometheus #kubernetes #k8s
https://tech.bedrockstreaming.com/2022/09/06/monitoring-at-scale-with-victoriametrics.html
#monitoring #victoriametrics #prometheus #kubernetes #k8s