
Little bit about monitoring, serverless and system understability. Have no silver bullet or clear algorithms but provide right approach to build and maintain systems.
https://read.acloud.guru/why-you-cant-effectively-debug-your-modern-systems-with-dashboards-57fe3ecd26bf
#monitoring
https://read.acloud.guru/why-you-cant-effectively-debug-your-modern-systems-with-dashboards-57fe3ecd26bf
#monitoring
A Cloud Guru
You can’t debug systems with dashboards | A Cloud Guru
The health of your systems doesn’t matter — what matters is that every individual event gets the resources it needs to complete Welcome to “Serverless Superheroes”!In this space, I chat with the toolmakers, innovators, and developers who are navigating the…
Monitoring: Back to the Roots
Far far away... 2 type of monitoring
https://stackify.com/rum-vs-synthetic-monitoring/
#monitoring
Far far away... 2 type of monitoring
https://stackify.com/rum-vs-synthetic-monitoring/
#monitoring
Stackify
Real User Monitoring (RUM) vs. Synthetic Monitoring Comparison
Understand the differences between real user monitoring (RUM) vs synthetic monitoring in order to ensure user satisfaction and gain a competitive edge.
Pro tip: setup integration for your monitoring and deploying systems. It's get visualization of "what release break all" and simplify debug.
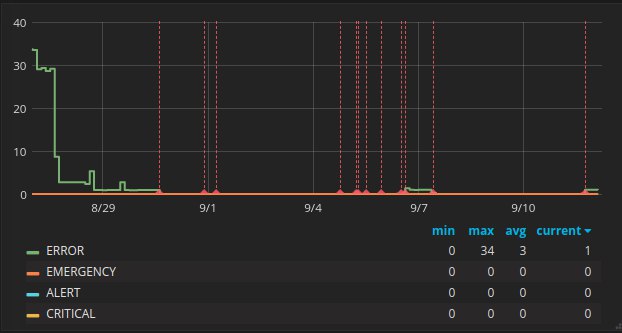
Requirements: Grafana 4.6+
For example, you have ~Zabbix~ Prometheus (monitoring), Teamcity (deploy), Grafana and some App.
1. Prometheus get some metrics from app and store to DB. We can visualize it in Grafana.
2. Teamcity successfully build and deploy new version of App.
NOW add new step after deploy which create Grafana Annotation about deploy to Prometheus.
It's add red line on your graphics so you can see which build fully of love.
P.S. On picture how can it look like.
#monitoring
Yet another #monitoring post :)
Now with little Docker EE ad, but if skip it, you find more good ideas then you can realize in nearest future.
https://blog.docker.com/2018/08/proactive-ops-for-container-orchestration-environments/
Now with little Docker EE ad, but if skip it, you find more good ideas then you can realize in nearest future.
https://blog.docker.com/2018/08/proactive-ops-for-container-orchestration-environments/
Good blog post about how to write a status page update from yet another monitoring company.
Also, they have useful engineering blog and pretty status page
#monitoring
Also, they have useful engineering blog and pretty status page
#monitoring
So cool monitoring solution in Grafana for Prom users, but we still using Zabbix ¯\_(ツ)_/¯
https://grafana.com/blog/2018/09/21/grafanas-explore-ui-taking-a-deeper-dive-into-data-with-prometheus-queries/
#monitoring #grafana #prometheus
https://grafana.com/blog/2018/09/21/grafanas-explore-ui-taking-a-deeper-dive-into-data-with-prometheus-queries/
#monitoring #grafana #prometheus
Grafana Labs
Grafana’s Explore UI: Taking a Deeper Dive into Data with Prometheus Queries | Grafana Labs
Grafana Labs has created the Explore UI, which allows you to iterate quickly through Prometheus queries, while leaving your dashboards intact. This post will walk you through a demo and show you how to try it out yourself.
KRS: A new tool for gathering Kubernetes resource statistics
What it lacks in a clever name, it makes up for in utility. KRS (short for Kubernetes Resource Stats) is a zero-configuration tool that makes it easy to collect resource stats, like how many pods are running in a certain namespace.
#kubernetes #monitoring
What it lacks in a clever name, it makes up for in utility. KRS (short for Kubernetes Resource Stats) is a zero-configuration tool that makes it easy to collect resource stats, like how many pods are running in a certain namespace.
#kubernetes #monitoring
Google have perfect blog-post about SRE & Devops
They explain complicated things in simple words:
1. The difference between DevOps and SRE
2. SLIs, SLOs, and SLAs
3. Risk and error budgets
4. Toil and toil budgets
5. Customer Reliability Engineering (CRE)
#monitoring #sre #culture
They explain complicated things in simple words:
1. The difference between DevOps and SRE
2. SLIs, SLOs, and SLAs
3. Risk and error budgets
4. Toil and toil budgets
5. Customer Reliability Engineering (CRE)
#monitoring #sre #culture
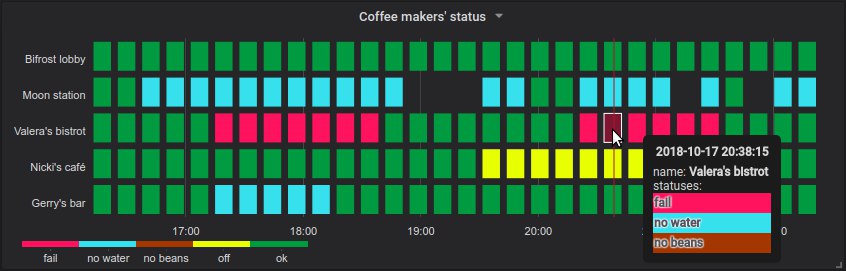
Cool grafana panel plugin to visualize status of multiple objects over time
https://github.com/flant/grafana-statusmap
Can be used as Status page or for investigation problems and their root case etc. Works with Prometheus and Grafana 5.
#monitoring #grafana #prometheus
https://github.com/flant/grafana-statusmap
Can be used as Status page or for investigation problems and their root case etc. Works with Prometheus and Grafana 5.
#monitoring #grafana #prometheus